Understanding Histograms In Photography. Hi, and a very warm welcome to Episode 164 of the Photography Explained podcast. I’m your host, Rick, and in each episode, I will try to explain one photographic thing to you in plain English in less than 27 minutes (ish), without the irrelevant details. I’m a professionally qualified photographer based in England with a lifetime of photographic experience, which I share with you in my podcast.
Here is the answery bit
A histogram is a graph that shows the range of tones in a photo from black to white. A histogram can help a photographer to get the correct exposure. A histogram shows the photographer if an image is underexposed or overexposed and if any data is lost in the shadows or highlights.
OK – that was the answery bit.
You can listen to the episode here
Or carry on reading – up to you.
Now, this might sound complicated, but it’s not too bad, don’t worry. And this episode is going to be much more to the point. I am refining this down to the histogram only. The last episode was a long one with lots of related stuff included.
Let’s get into this.
Where can I find the histogram?
On the back of your camera, on the LCD screen, and also somewhere in your image processing software. I know you can see the histogram in Lightroom, which I use. I assume other software shows you the histogram as well?
Yes, it is in your camera, so camera manufacturers think it is important, so it is worth us understanding it, right? With my Canon 6D, I can view it when I am taking photos in Live View Mode, using the LCD screen, and I can also review the histogram on the LCD screen after I have taken a photo.
And I assume that all modern digital cameras have a histogram feature within.
What is the histogram showing me?
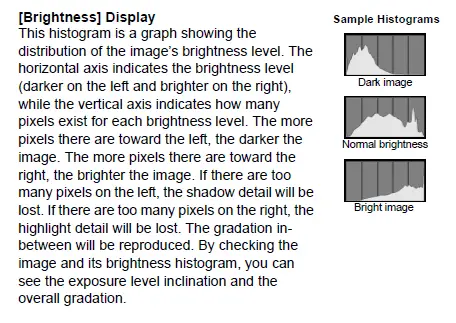
It is a graph showing the distribution of the image’s brightness level. The left-hand end is pure black. The right-hand end is pure white. And in the middle is everything from black to white.
So, we go from pure black at the left-hand end, through the shadows, then the midtones, then the highlights, all the way to pure white at the right-hand end of the scale.
The vertical bars represent the number of pixels for each brightness level. The higher the bar, the more there is.
So horizontal axis – brightness level from black to white.
Vertical axis – number of pixels.
A histogram is a brightness histogram. And you might come across the term luminosity histogram. They are the same thing. As is a luminance histogram. A histogram is also described as showing the tonal value range; this again means the same thing. The tonal range is a range of brightness.
That is what it is showing you, but what does this mean?
If there is data in the vertical bar to the extreme left, you have lost some of the detail in the blacks or shadows. This is called clipping. If there are lots of vertical bars on the left-hand side, you are underexposing. You will get an underexposed image. You will lose shadow detail. We don’t want that.
If there is data in the vertical bar to the extreme right, you have lost some of the detail in the whites or highlights. This is also called clipping. If there are lots of vertical bars on the right-hand side, you are overexposing. You will get an overexposed image. You will lose highlight detail. We don’t want that.
If you have a histogram which does not reach either the left or right-hand end, then it looks like you have got the exposure correct; you have correctly recorded the brightness levels in a scene.
The more pixels there are to the left, the darker the image. And the more pixels to the right, the brighter the image. Too many pixels to the left, we lose detail in the shadows; too many pixels to the right, we lose details in the highlights.
And that is all a histogram is—a very important visual representation of the exposure of a photo. The histogram shows you the exposure of your image.
A histogram is a visual representation of the light captured.
Is that all?
No, not really. Sorry, there are two types of histograms. There is also an RGB histogram. RGB is red, green and blue. Also known as a colour histogram, this shows the amounts of each colour and the mix of colours.
I have never used the colour histogram, so I will do the decent thing here and move on. If you want to know more about colour histograms, let me know, but please remember that I have managed without them, rightly or wrongly, for a long time now, OK?
I have made you aware of them and have also told you that you don’t need to worry about them too much, so let’s move on.
OK, that is what histograms are. Not too bad, was it?
What does clipping mean?
Clipping is a term used to describe an area of the highlights or shadows that have not been correctly captured or processed. Shadow clipping means you have lost some shadow detail. Highlight clipping means that you have lost some of the highlights.
Clipping is also a term that you will find being used for removing the background from a photo. That doesn’t help, does it?
How can I use a histogram to help me take better photos?
Get the histogram up on the lcd screen on the back of your camera. You can view the histogram of what you are taking a photo of before you take the photo, which is pretty cool. Yes, you can see if your camera settings will give you a correct exposure or not; you can see if there will be a loss of detail.
And on some cameras, you can set the camera so that underexposed or overexposed parts of a photo are flashing. These things are commonly called blinkies.
Now, don’t forget the general rule here – if something is flashing when you take a photo or look at a photo you have taken, there usually is something we need to fix.
You are looking for a nice distribution of light, with nothing reaching the left or right edges. OK? If you have not got this, you must change something to get the correct exposure, usually the aperture or shutter. Or the ISO.
Too many pixels to the left? You are underexposing. You need more light, so you need a larger aperture to let more light in or a slower shutter speed, exposing the camera sensor to light for longer. Or change to a higher ISO value.
Too many pixels to the right? You are overexposing. You need to reduce the amount of light, so you need a smaller aperture, letting less light in, or a faster shutter speed, exposing the camera sensor to light for less time. Or choose a lower ISO.
You can quickly make these adjustments using exposure compensation.
That wasn’t too bad.
What does a good histogram look like?
There are no vertical bars on the graph’s left or right-hand ends. And beyond that, it is impossible to describe in words. Check out the blog post where I have included examples from Canon in the Canon 6D Manual, one of my go-to written references for all things photography-related.
And here it is!
There is no ideal histogram, there is no perfect histogram, but there are bad histograms.
Histograms and the exposure triangle
You can use the exposure triangle with the brightness histogram to get the correct exposure. The exposure triangle gives you ways to adjust the exposure; the histogram shows you the exposure.
Here is the talky bit
There is more that I could have said here. But this is the bit that is relevant to me; this is the bit that helps me to take better photos. So, all the other stuff I am leaving out. This is what we need to know.
Getting the best exposure that we can is important. And we can use the camera’s histogram to help us.
There is no such thing as a perfect histogram. There are so many variables in every photo that we take when it comes to light and brightness. So, don’t even try to get the perfect histogram.
But you can use the histogram graph to help you get the best exposure you can.
As to the graph, what is that vertical axis showing us?
It is the brightness value. The amount of brightness. It is referred to as the number of pixels, but Canon calls it the erm Brightness Histogram, which works for me!
Use the histogram to help you get the best exposure that you can. I touched on this before: all major camera manufacturers have histograms built into their cameras, and there must be a reason for this, right?
A histogram is one of the best tools to get the best exposure you can every time. Writing this has reminded me that I need to be more diligent myself.
And a thought has quite literally just entered my head. If you like the high key effect, a technique where you get overexposed, very light and bright photos with little or no shadows, you can use the histogram to recreate the same effect on another photo. I have said that we should always try to get the best exposure we can; sometimes, the best exposure can be an overexposed image if that is what you are after.
Right – talky bit over. That was a nice short one.
What if I use a phone and not a camera?
I have never used a histogram for photos taken with my phone.
You can get apps that have histograms that show you the exposure. I even found one that explains histograms in underwater photography!!
A histogram on a phone tells you the same things as a histogram on a camera, so everything I have said so far applies. After all, it is a visual representation of the tonal values in a photo.
What if I use a film camera?
You won’t have a histogram. That’s it. This is a digital photography thing. Now, is that a good thing or a bad thing?
I’ll let you decide that.
What do I do?
I use the brightness histogram to check the exposure is correct. I haven’t always done this, but I have been doing so more and more as this is best practice. These days, I am all about getting the highest quality image every time I take a photo.
I have never used the RGB histogram. You can use one or the other with the Canon 6D. One or the other. I choose brightness. I am not clear how the colour histogram will help me.
I can check the exposure before I take a photo, which is great, allowing me to tweak the exposure to get the first image bang on. And I tweak the exposure using exposure compensation. And I take three photos: one with the correct exposure, one two stops underexposed, and one two stops overexposed. I want a wider dynamic range than my Canon 6D can capture in a single image. But I always get the best exposure that I can with that first image. I treat the first image as the only photo I will take, as though this will be the final image. And then, I add more of the lights and darks.
The brightness histogram is on the LCD screen on the back of my camera. This is great for me as I compose using the viewfinder and the LCD screen, which is fine.
And as I take photos using a tripod, I can do this. If I were taking photos handheld, I wouldn’t be able to do this. I have never thought about that before. But how would that work? You can see the histogram in the electronic viewfinder on some mirrorless cameras (well, I think you can), but how small is it?
More for the case for taking photos with a tripod!
This is what I do.
Some thoughts from the last episode
Photography Explained Podcast Episode 163 – Why Is Sharpness In Photography So Important?
Well, it was a long one. I took sharpness and everything related to it. And it worked for me. So that is good.
Just one thing that I would like to remind you. When talking about shutter speeds, we often talk about using a fast enough shutter speed to get sharp photos. So, we talk about the minimum shutter speed. But, it is worth saying that if you are fortunate enough to have fast shutter speeds to get the correct exposure, 1/500th second, 1/1000th second, or faster, that is fine and normal, and you are in a good place. You can use faster shutter speeds for any photography, you don’t have to just use faster shutter speeds for fast-moving things.
And with faster shutter speeds, you can still take photos with your camera on a tripod. Or not.
Next episode
Do I Really Need A Camera In 2023? Or Will My Phone Do Instead? Yes, I am back to that fundamental question I ask yearly. This will be a free-flowing whatever is in my head episode. There will be lots of ad-libbing in this one, which I look forward to writing and recording.
Ask me a question.
If you have a question you would like me to answer, head over to the podcast website – photographyexplainedpodcast.com/start, where you can find out what to do. And feel free to just say hi. It would be lovely to hear from you.
I am done.
This episode was brought to you by, erm, a cheese and pickle sandwich and bag of salt and vinegar crisps, washed down with an ice-cold Diet Pepsi before I settled down in my homemade, acoustically cushioned recording emporium. Today’s acoustic treatment is my new blackout blind and two pillows. That is the final solution. There is no need for any more.
I’ve been Rick McEvoy; thanks again very much for listening to my small but perfectly formed podcast (it says here) and for giving me 27 ish minutes of your valuable time. This episode will be about 30 minutes long after I have edited out the mistakes and other bad stuff.
Take care, stay safe.
Cheers from me, Rick
OK – that was the podcast episode.
Want to know more?
Head over to the Start page on the Photography Explained Podcast website to find out more.
And here is the list of episodes published to date – you can listen to any episode straight from this page which is nice.
Let me know if there is a photography thing that you want me to explain and I will add it to my list. Just head over to the This is my list of things to explain page of this website to see what is on there already.
Let me send you stuff
I send out a weekly email to my subscribers. It is my take on one photography thing, plus what I have been writing and talking about. Just fill in the box and you can get my weekly photographic musings straight to your inbox. Which is nice.
And finally a little bit about me
Finally, yes this paragraph is all about me – check out my Rick McEvoy Photography website to find out more about me and my architectural, construction, real estate and travel photography work. I also write about general photography stuff, all in plain English without the irrelevant detail.
Thank you
Thanks for listening to my podcast (if you did) and reading this blog post (which I assume you have done as you are reading this).
Cheers from me Rick